Threat alert prioritization and incident triage, clarity under fire for SOC analysts.
The result, first
I collapsed a 9-tool, tab-hopping triage into one dark-mode screen, simulated mean-time-to-triage fell 40%, with the top 5 critical alerts always above the fold.
Product
Sentinel Dash, a threat-prioritisation and incident-triage dashboard for Security Operations Centre analysts.
Business problem
SOC teams triaged across 3–5 separate tools with no prioritisation, so critical threats surfaced late under 2,000+ equal-weight alerts per shift.
Target users
Tier 1 analysts triaging under load, Tier 2 investigators, and SOC Managers overseeing throughput.
SOC analysts have one of the toughest jobs in enterprise software. A shift can mean thousands of alerts, each one triaged in seconds, and getting one wrong can let a real attack through.
The old setup buried the alerts that mattered under the ones that didn't. The goal was one screen that does the sorting for them: rank alerts by risk, map each one to MITRE ATT&CK, suggest a next step, and stay in dark mode for the long shifts.
I handled UX and UI over a six-week sprint, working with a data-science team, a couple of senior analysts, and an engineering lead.
I put the 40% and the “top 5 above the fold” first because in security the only thing that really counts is whether the analyst catches the threat in time.
How I researched it
The brief called this an “alert volume” problem. I wasn't convinced, so before designing anything I spent the first week watching analysts work and reading up on how SOC teams actually operate.
I wanted one thing from research: where a Tier 1 analyst actually gets stuck, in their own words, with a number attached. Almost every decision after this, the three panels, the severity colours, the dismiss loop, came out of something I found here.
Methods
On-shift shadowing
Three days across a day and a night shift, sitting next to Tier 1 and Tier 2 analysts and counting how many tools it took to close one serious alert.
Analyst interviews
Six interviews across Tier 1, Tier 2 and a SOC Manager. I picked people at opposite ends on purpose, so their conflicting needs would show up.
Secondary research
MITRE ATT&CK for a shared way to name threats, plus a few published studies on SOC workflows and alert fatigue, so the design wasn't just my hunch.
Competitive teardown
Looked at Splunk ES, Chronicle and an older SIEM console to see where they skipped prioritisation and where they made you switch tools.
What the floor told me
9tools per incident
Closing one serious alert took nine hops across three to five tools. The problem was the switching, not the number of alerts.
2,000+look-alike alerts a shift
A critical alert and a routine one looked exactly the same in the list. That's what wore people down, not the raw count.
“to be safe”the confidence gap
Analysts usually had enough data to make the call but not enough confidence, so when unsure they just escalated. The recommended actions needed to help them decide, not decide for them.
0signal from a dismiss
When someone dismissed a false positive, nothing happened with it. The scoring model never learned, so it kept showing the same junk.
What I found flipped the problem around. It looked like too many alerts, but it was really too much jumping between tools. That pointed at three things to fix: get the nine tool-hops down to one screen, make severity obvious so the list stops hiding what matters, and make a dismiss actually do something so the system gets better over time. I also split the users into three tiers, since a Tier 1 analyst and a SOC Manager want almost opposite things from the same data.
Timing the tool-hops was the most useful thing I did. “Nine per incident” turned a vague complaint about noise into a target the whole team could aim at.
Who I was designing for
The brief said “alert volume,” but three days of shadowing told a different story. The real problem was switching between tools, nine hops just to resolve one serious incident.
Once I designed for the switching instead of the volume, everything else fell into place. I split the users into three tiers, because a Tier 1 analyst and a SOC Manager need almost opposite things from the same screen.
About
Works the front line of the SOC, triaging a relentless alert queue at speed, where a missed critical threat has real consequences.
Goals
Clear the queue quickly
Never miss a critical alert
Act with confidence, not guesswork
Frustrations
Every alert looks the same
Context lives in 3–5 other tools
Escalates to Tier 2 when unsure
Had the data to triage but lacked the confidence to act, so recommended actions were decision support, not a shortcut for experts.
About
Picks up escalated incidents and works them end to end, pivoting through logs, assets, and threat context to reach a verdict.
Goals
Investigate without losing context
Pivot fast across evidence
Reach a defensible verdict
Frustrations
Tool-switching breaks the flow
Context scattered across systems
Re-gathering what Tier 1 already saw
Needed depth and pivot context, which justified an inline detail drawer over yet another separate tool.
About
Accountable for how fast and how accurately the team clears threats, and for the prioritisation policy the whole floor works against.
Goals
Right alerts rise first
Tune priority per team
Keep response quality consistent
Frustrations
One global scoring model for all teams
No per-team weighting
Hard to see where triage stalls
Wanted to tune scoring weights per team, a real need I scoped to the roadmap rather than force into v1.
Before Sentinel Dash, a Tier 1 analyst would open a queue of 2,000+ look-alike alerts, jump to the SIEM for logs, open another tab for MITRE context, and then, still not sure if the alert was even real, escalate to Tier 2 just to be safe. Each tool worked fine on its own. Together they buried the one alert that mattered.
1Alerts flood in
Priya opens the dashboard to 2,000+ alerts in one flat list, all equal weight.
AnimationTop 5 critical pin above the fold
Open top alert
2Open the incident
One click expands the incident drawer, logs and affected assets load inline, no new tab.
AnimationDetail panel slides in (<200ms)
Read MITRE
3MITRE + action
The ATT&CK chain and a recommended response sit in the right panel, beside the alert.
AnimationMITRE chain draws in
Act / dismiss
4Resolve on one screen
She acts, or dismisses a false positive, a single click that feeds the scoring model.
AnimationAlert clears, queue re-ranks
Priya, Tier 1 SOC Analyst
She wants to get through a shift of thousands of alerts quickly and confidently, without letting a real threat slip past. This is the before map that pushed the single-screen redesign.
Alert Intake
Investigate
Decide
Escalate / Resolve
Opens the queue at shift start
Thousands of alerts, all equal weight
Pivots to the SIEM for logs
Opens a separate tab for MITRE context
Weighs severity with no guidance
Unsure whether it's real or noise
Bumps the ticket to Tier 2
Moves on to the next alert
Satisfaction
“Where do I even start?”
“Five tabs open just to judge one alert.”
“When in doubt, I escalate to be safe.”
“Another one passed up, I hope that was right.”
I watched people work before I sketched anything. If I'd taken “alert volume” at face value, I'd have built filters for a problem that was really about switching tabs.
What made the cut, and what didn't
Six weeks and three personas meant I had to be picky. I built the Tier 1 triage view at full fidelity, since it's the riskiest and most-used screen, and handed off the Tier 2 and SOC Manager views at mid-fidelity with plenty of notes.
The tempting thing to keep was letting analysts configure everything. I cut it anyway. Someone already drowning in alerts shouldn't have to design their own dashboard on top of that.
Shipped in v1
Full-fidelity Tier 1 single-screen triage view
Recommended-actions library mapped to MITRE ATT&CK tactics
Dark-first colour and contrast system for 8–12 hour shifts
False-positive dismiss with a scoring feedback loop
Deliberately cut
Analyst-configurable dashboards: Put the information-design burden back on already-overloaded analysts; a fixed scoring-driven hierarchy served them better.
Per-team scoring-weight configuration: A real SOC-Manager need, but out of scope for a six-week sprint, moved to the roadmap.
Two-panel low-resolution fallback: Designed but deprioritised for v1, a call I later regretted (see Evaluation).
Light mode: Explicitly out of scope; extended shift use made dark-first a health requirement, not a preference.
Most of the content work went into the recommended-actions library. For each MITRE ATT&CK tactic I wrote a short response script, so a junior analyst gets a clear next step during triage instead of raw data they have to decode. Senior analysts checked every entry so it still held up for experienced users.
The scope call I'm most sure about was saying no to configurability. A “flexible” dashboard would have quietly handed the hardest part of the job back to the user.
How the product was organised
The structure had one job: keep everything a Tier 1 analyst needs to make a call on one screen. Tabs would have rebuilt the exact tool-switching problem I was trying to kill.
So it's a three-panel layout, alert list, incident detail, and MITRE context with actions, and the detail drawer opens in place instead of taking you somewhere else.
Sentinel Dash
Triage · Tier 1
Alert queue
Top 5 critical
Full list
Dismiss false positive
Incident detail
Log context
Affected assets
MITRE chain
Actions
Recommended response
Escalate to Tier 2
Investigation · Tier 2
Escalated incidents
Evidence timeline
SOC Manager
Team throughput
Scoring policy
Settings
Alert scoring
Dark-mode display
Triage a critical alert without leaving the screen
The analyst starts in the top-5 critical band, opens the incident drawer in place for logs and affected assets, reads the MITRE chain and the suggested action right next to it, and acts. The only fork is real versus false positive, and even the false-positive path stays on screen and feeds the scoring loop instead of hitting a dead end.
Handle a false positive
One click clears the alert and tells the scoring model about it. That fixed a loop that used to be broken: before, dismissals just disappeared, so the algorithm kept bringing the same junk back.
I made dismissing a false positive as quick and on-screen as handling a real one, because every dismissal that went nowhere was teaching the algorithm to stay wrong.
From lo-fi thinking to hi-fi execution
The wireframes had to prove the three-panel idea worked before colour could justify anything. Each layout answered one blunt question: can a Tier 1 analyst reach a decision without their eyes or their cursor leaving the screen?
Fidelity was a budget, and I spent it where the risk was. Tier 1 got a high-fidelity prototype; the other two views stayed at mid-fidelity with notes.
The rough layouts were about proportion and reading order: where your eye lands first, how the drawer opens without shoving the queue off screen, and whether MITRE context could sit next to the alert instead of a click away.
The big change in high fidelity was making severity readable at a glance. I colour-coded the tiers to the data-science team’s score breakpoints, so the order matched real threat level instead of my taste. Engineering also capped the drawer at a 200ms load, which decided how much it could show without slowing the analyst down.
I left two of the three views at mid-fidelity on purpose. Spreading the polish evenly would have left the one screen that really matters half-baked.
The look, the system, and the words
Dark mode wasn't a style choice. On 8–12 hour shifts it's closer to a health decision. The colour system earns its place too: severity, MITRE tactic, and freshness all read at a glance, no legend needed.
The top five critical alerts sit at the top of the screen and stay above the fold, so the most important thing is never something you have to scroll to find.
Severity tiers
Colour tied to the data-science score breakpoints, so the visual hierarchy always reflects real threat level.
MITRE tactic tokens
Consistent colour and label per ATT&CK tactic, making the mapping readable inline at the moment of triage.
Dark-first contrast scale
Contrast tuned for long night shifts; every state legible without a light-mode fallback.
Recommended action“Isolate host, then verify lateral movement”: Written as a next step, not a description, junior analysts needed an instruction they could act on immediately.
False-positive dismiss“Not a threat? Dismiss, this trains the scoring.”: Tells the analyst the dismissal does something, which is what finally closed the feedback loop.
Empty triage queue“Queue clear. Critical alerts surface here first.”: Reassures without implying the shift is over, and sets the expectation for where the next signal appears.
The recommended-action lines were the most important writing on the project. One clear instruction is the difference between a junior analyst handling it and escalating everything to Tier 2.
Component anatomy & structure
I built the component library the same way the Figma is structured: atomic design, going from atoms up to organisms. Each level is made only from the level below it, so every screen is basically the same tested pieces put together in a new way.
The whole system is dark by default, with one teal accent for the primary action and red kept only for critical and destructive things. The type is Public Sans. Every component had to stay readable at a glance in dark mode, ten hours into a shift. Below is each real component from the deck, with its parts, its states, and why it is built the way it is.
AtomsThe indivisible tokens, nothing smaller carries meaning on its own.
Button
The one action primitive. Only a single teal primary shows per view, so the main move is never in doubt.
Isolate hostDetailsDismissDisabled
Anatomy
ContainerA fully rounded pill at 999 radius, so every button reads as the same family across the product.
LabelPublic Sans SemiBold, kept to one or two words so the action is instant to read.
Type tokenPrimary is teal with black text, secondary is dark grey, destructive is red. The colour itself tells you the weight of the action.
States
PrimarySecondaryDestructiveDisabled
Structure & logic
Colour carries the meaning here, not just the label. Teal means go, red means this cannot be undone, grey means secondary. Because it is one shared pill, the same button looks the same whether it sits in a toolbar, a dialog or a card.
Badges
The small status pill used for severity and state, so a label always reads the same wherever it appears.
Normal Overloaded Watch Label
Anatomy
Outline pillA rounded outline in the status colour, teal, red or amber, kept light so it never shouts louder than the alert itself.
Trend arrowAn optional up or down arrow when the badge is showing a direction.
Label + closeA short label with an optional close icon when the badge is a removable filter.
States
TealRedAmberNeutralRemovable
Structure & logic
The colour is tied to meaning and not chosen per screen, so red always reads as critical and teal as safe. Keeping it as a light outline instead of a solid fill means a row can carry two or three badges without the whole thing turning noisy.
Checkbox
The select control for multi-select in the queue and the table.
Anatomy
BoxA small rounded square with a 1.5px border in the unchecked state.
FillTeal fill with a black tick once checked, so a selected row is obvious even in a long list.
IndeterminateA teal box with a dash, for the header checkbox when only some rows are selected.
States
UncheckedCheckedIndeterminate
Structure & logic
The checked and indeterminate states both use the same teal, so the eye groups them together as one selection language. The indeterminate dash matters for bulk actions, since a manager selecting a page of alerts needs to see at a glance that the selection is partial.
Input / Search
The one field an analyst uses to search alerts, IPs, hashes and domains without leaving the queue.
Search iconA leading magnifier so the field reads as search straight away.
PlaceholderSearch alerts, IPs, hashes, domains, which doubles as a hint of what you can actually search.
Focus ringA teal ring on focus, the same teal as the primary action, so focus is never in doubt.
States
DefaultFocusedFilledDisabled
Structure & logic
The placeholder is doing real work, it tells the analyst the search covers more than just alert names. The teal focus ring is the same accent used everywhere else, so keyboard focus stays visible even on the dark background.
Featured Icon
The soft circular icon that sits at the top of dialogs and empty states to set the tone before a word is read.
Anatomy
Tinted circleA soft circle in the semantic colour, teal for info, red for danger, amber for warning.
Line iconA simple line icon inside, an exclamation, a tick or a warning triangle.
Size stepsA few sizes so the same icon works in a small toast and a large confirmation dialog.
States
InfoSuccessWarningDanger
Structure & logic
The colour of the circle tells the analyst the type of moment before they read anything, so a red circle on a dialog already means slow down. Keeping the icon as a thin line inside a soft tint stops it from feeling like an alarm every single time.
Icon Button
A compact icon-only control for secondary actions like a menu or a close.
Anatomy
IconA single line icon, centered, with no label.
Hit areaA square touch area larger than the icon itself, so it is easy to hit.
Hover haloA soft teal circle appears on hover to show it is live.
States
DefaultHoverDisabled
Structure & logic
These are for actions that do not deserve a full labelled button but still need to be reachable. The hover halo matters because an icon on its own gives no feedback, and on a dark screen an analyst needs to know their cursor is actually on something.
Avatar
The person marker for analysts and assignees across the table and the sidebar.
Anatomy
CircleA round frame holding a photo, or a fallback person icon when there is none.
Size stepsSmall, medium and large, so the same avatar works in a dense row and in the sidebar footer.
States
SmallMediumLargeFallback
Structure & logic
It is a small thing but it makes ownership human, so a manager scanning the table sees who is on what without reading names. The fallback icon keeps rows tidy when a photo is missing, instead of leaving an empty hole.
Theme Toggle
The switch between light and dark, though the product lives in dark by default.
Light Dark Light Dark
Anatomy
Segmented pillA two-part pill with Light and Dark, each with its own sun or moon icon.
Active segmentThe selected side fills dark so the current theme is obvious.
States
LightDark
Structure & logic
Dark is the default because of the long shifts, but the toggle stays because some analysts work in bright rooms during the day. Showing it as a segmented control, rather than a hidden switch, makes it clear that both themes are proper supported states and not an afterthought.
Tab Item
The single tab unit that the Tab Bar is built from.
OverviewOverview
Anatomy
LabelOne word like Overview, sized for quick scanning.
Active pillThe selected tab fills into a dark pill, everything else stays plain text.
States
DefaultActive
Structure & logic
I kept only two states on purpose, plain and active, so the eye instantly finds where it is. Filling just the active tab, instead of underlining, keeps the bar calm even when there are five tabs in a row.
Menu Item
The single row that menus and popovers are built from.
Block source IP Isolate host
Anatomy
IconA leading line icon to give the action a shape before the word.
LabelThe action text, in one short phrase.
Destructive variantA red icon and red label for actions like isolate or delete.
States
DefaultHoverDestructive
Structure & logic
The destructive variant is red so a dangerous action never looks like the safe ones sitting next to it in the same menu. Leading every row with an icon means an analyst can find the right action by its shape, which is faster than reading each label at 3am.
Progress Bar
A thin bar for load and capacity, like how full an analyst’s queue is.
Anatomy
TrackA dark rounded rail as the background.
FillA coloured fill, teal or green when healthy, amber and red as load climbs.
States
LowMediumHighOverloaded
Structure & logic
The colour of the fill changes with the level, so a manager reads an overloaded analyst as a red bar without checking the number. It reuses the same red to teal range as the rest of the system, so full always feels bad and empty always feels fine.
MoleculesAtoms combined into a single, reusable unit of meaning.
Alert Card
The main alert summary, the thing an analyst reads first to decide if something needs attention right now.
Severity badgeA red Critical outline pill with an ID and a timestamp, so the weight and the age read together.
Title + descriptionA large alert name with a one-line plain-English description under it.
Asset chipThe affected host with a monitor icon, so where is never a separate lookup.
Risk scoreThe numeric score, large, on the right, as the single number the eye ends on.
States
CriticalHighWatchInfoSelected
Structure & logic
The reading order is deliberate, severity and age first, then what and where, then the score on the right. It is built from smaller atoms, the badge, the asset chip, the score, so the same pieces show up identically in the drawer and the table.
KPI Metrics
The summary tile for a single number a manager watches, like active incidents.
Active Incidents
54 52%
Anatomy
Hex icon + labelA small teal hexagon icon and a label like Active Incidents at the top.
Big numberThe value in large type, the thing you actually read from across the room.
Trend pillA teal up or down pill showing the change, so the number has direction.
MenuA quiet three-dot menu for changing the range, kept out of the way.
States
DefaultPositive trendNegative trendLoading
Structure & logic
The number is the loudest thing and everything else supports it, because on a manager’s dashboard the value is what matters at a glance. The trend pill uses the same teal and red as the rest of the system, so up and down never need a second look.
Chart
A small sparkline for trend at a glance, without a full graph.
Anatomy
LineA single smooth line showing the shape of the trend.
Gradient fillA soft fade under the line, green when it is going the right way, red when it is not.
States
PositiveNegative
Structure & logic
It is meant to be read as a shape and a colour, not as exact numbers, because inside a tile the direction is the message. The green and red fills carry the good or bad reading, so it works even when the sparkline is tiny.
Dropdown / Select
The select for choosing a source, a range or an assignee.
Select Source Select Source Select Source
Anatomy
FieldA dark pill showing the current value, like Select Source.
ChevronA trailing chevron so it clearly reads as openable.
Focus ringThe same teal focus ring as the input, so all fields behave alike.
States
DefaultFocusedDisabled
Structure & logic
It shares the exact pill shape and teal focus ring with the search input, so every field in the product feels like one family. Keeping the closed state simple, just value and chevron, means it does not compete with the data around it.
Toast
The quick confirmation that an action worked, or a warning that something changed.
Host isolatedWKS-FINANCE-042 has been quarantined.
Connection lostAlert data may be stale, showing cached results.
Anatomy
Accent borderA left border, green for success and red for a problem, so the type reads before the words.
Icon + titleA tick or warning icon with a short bold title like Host isolated.
Body + closeA muted line of detail and a close icon.
States
SuccessError
Structure & logic
The coloured left border does the fast reading, green means it worked, red means look closer, before the analyst even reads the title. It stays short so it confirms an action without pulling attention away from the queue.
Tab Bar
The switch between views inside an incident, Overview, MITRE, Timeline, Logs, IOCs.
OverviewMITRETimelineLogsIOCs
Anatomy
Tab itemsA row of Tab Item atoms, only one active at a time.
Active pillThe selected tab fills into a dark pill.
States
OverviewMITRETimelineLogsIOCs
Structure & logic
It is just Tab Item atoms lined up, which keeps every tab identical and the active one obvious. Grouping the incident views into one bar means an analyst pivots through evidence in place, instead of opening a new tool for each one.
Menu / Popover
The floating action menu on an alert, holding the full set of responses.
Isolate host Block source IP Escalate to Tier 2 Mark as false positive Add note
Anatomy
PanelA dark rounded floating panel that sits above the row.
Action rowsMenu Item atoms, Isolate host, Block source IP, Escalate to Tier 2, Mark as false positive.
Divider + noteA divider before a lighter action like Add note, to separate weight.
States
ClosedOpen
Structure & logic
The destructive action, isolate host, sits at the top in red so it is easy to reach but impossible to mistake for a safe one. The divider before Add note groups the heavy actions apart from the light housekeeping ones.
Quick Actions Toolbar
The inline action strip on a single alert, for the common moves without opening the menu.
Isolate hostBlock IPEscalateDismiss
Anatomy
Pill containerA dark rounded bar holding the actions in a row.
Primary actionIsolate host as a teal pill, the one most likely next step.
Secondary actionsBlock IP and Escalate as plain text, Dismiss kept muted.
States
DefaultHover
Structure & logic
Only the single most likely action is teal, the rest stay quiet, so the analyst is nudged toward the common move without the others getting in the way. Dismiss is deliberately the most muted, since it should feel like a small, easy action and not a loud one.
Bulk Action Bar
The action bar that appears once several alerts are selected together.
Selection count1 alert selected, so the scope of the next action is always clear.
Primary + secondaryEscalate as a teal pill, then Resolve and Mark false positive as plain actions.
Dismiss + ClearThe lighter actions kept muted at the end.
States
One selectedMany selected
Structure & logic
It always shows the count first, because acting on the wrong number of alerts in bulk is exactly the mistake this bar has to prevent. It reuses the same button hierarchy as everywhere else, one teal primary and the rest quiet, so bulk work feels no different from single-alert work.
Confirmation Dialog
The stop-and-check step before an action that cannot be undone, like isolating a host.
Isolate WKS-FINANCE-042?This quarantines the endpoint from the network. Active sessions end immediately and the action is logged.
AssetSRV-FILE-01
Risk score98 · Critical
Active sessions3
CancelIsolate host
Anatomy
Danger iconA red warning Featured Icon at the top, so the tone is set immediately.
Title + explanationIsolate WKS-FINANCE-042? with a plain line on what it actually does.
Detail tableAsset, risk score and active sessions, so the analyst confirms with the facts in front of them.
ActionsA quiet Cancel and a red Isolate host, so the dangerous button is clearly the committed one.
States
Default
Structure & logic
It shows the real consequences, active sessions will end, right next to the button, so nobody confirms on trust alone. The red icon and red confirm button both say the same thing, this is the serious one, which is worth the extra friction when a wrong click takes a machine offline.
Table Row
The dense row for the manager’s analyst-and-throughput table.
071238116m Normal
071238116m Overloaded
Anatomy
AvatarThe analyst the row belongs to.
Numeric columnsCounts and times, tabular-aligned so columns actually line up.
Status pillA green Normal or red Overloaded badge at the end of the row.
States
NormalOverloaded
Structure & logic
The numbers are tabular-aligned so a manager can scan a column straight down without the digits jumping around. The status pill at the end uses the same green and red as the rest of the system, so an overloaded analyst is spotted from the colour before the numbers are even read.
Pagination
The pager for long lists, like the full alert history.
Page 2 of 10
PreviousNext
Anatomy
Position textPage 2 of 10, so you always know where you are in the list.
Prev / NextTwo dark pills, disabled at the ends of the range.
States
DefaultFirst pageLast page
Structure & logic
It keeps to plain Previous and Next rather than a long row of page numbers, because in triage you move through a list in order, you rarely jump to page 7. Showing the position as text is enough for orientation without cluttering the bar.
OrganismsMolecules and atoms assembled into a working section of the interface.
Sidebar
The narrow navigation rail that holds the whole product together.
Anatomy
LogoThe teal burst mark at the top as the home anchor.
Nav iconsDashboard, incidents, alerts, playbook and settings, each a line icon.
Active ringA teal ring around the current section, so location is always visible.
AvatarThe analyst’s avatar pinned at the bottom.
States
CollapsedItem activeHover
Structure & logic
It is kept narrow and icon-only so it takes almost no space away from the queue, which is where the work actually happens. The teal ring on the active icon is the one piece of navigation state an analyst needs, so I made that the only thing highlighted on the whole rail.
Rebuilding this section straight from the real Figma deck was the point. Every screen in the product is just these same atoms and molecules rearranged, which is what kept the mid-fidelity handoff clean, engineering built up from the same parts I had already tested.
UI design & the logic behind it
Once the system was in place, the UI was where all of it had to actually work for someone at 3am. Every layout, colour and interaction below comes from a research finding or a component rule, not from what looked nice.
The whole thing is dark-first, and the colours pull their weight: severity, MITRE tactic and how fresh the data is all read at a glance, no legend.
01
Signal over chrome
The top five critical alerts sit at the top of the screen and never drop below the fold. I cut anything decorative until the most important thing was impossible to miss.
02
One decision per glance
On every screen your eye moves from severity to context to the recommended step, so it always ends on “what do I do next.”
03
Colour is meaning, not decoration
Every colour is tied to a token, severity, MITRE tactic, or freshness, so a colour always means the same thing, and nothing is coloured just to fill space.
04
The false-positive path is first-class
Dismissing is just as quick and on-screen as acting, because every dismissal that led nowhere was teaching the algorithm to stay wrong.
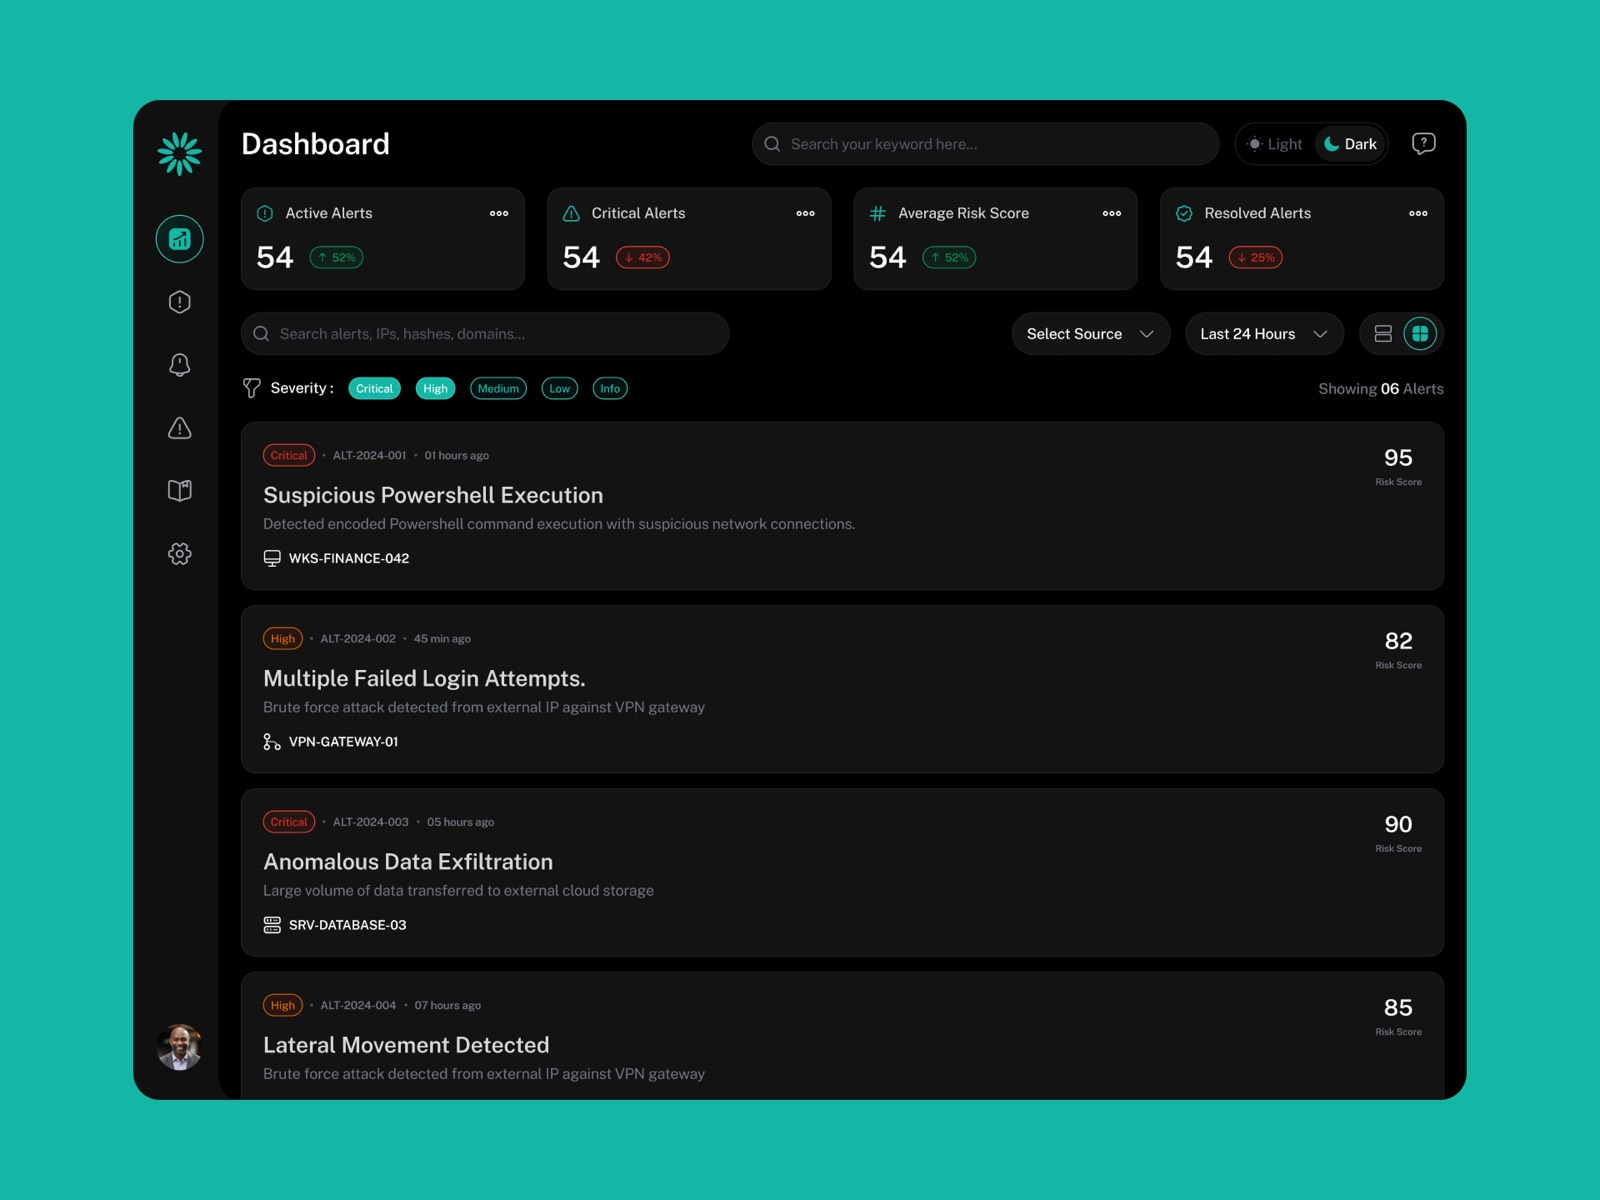
01
The triage view
The top-5 critical band is pinned above the fold and set apart from the rest of the queue, so the riskiest alerts are never something you scroll for.
The queue is one column of alert rows that all read the same way, and the severity rails turn the whole list into a colour map of what matters.
The density is set for a 2,000-alert shift, compact rows, lined-up scores, without becoming the wall of sameness the old tools had.
02
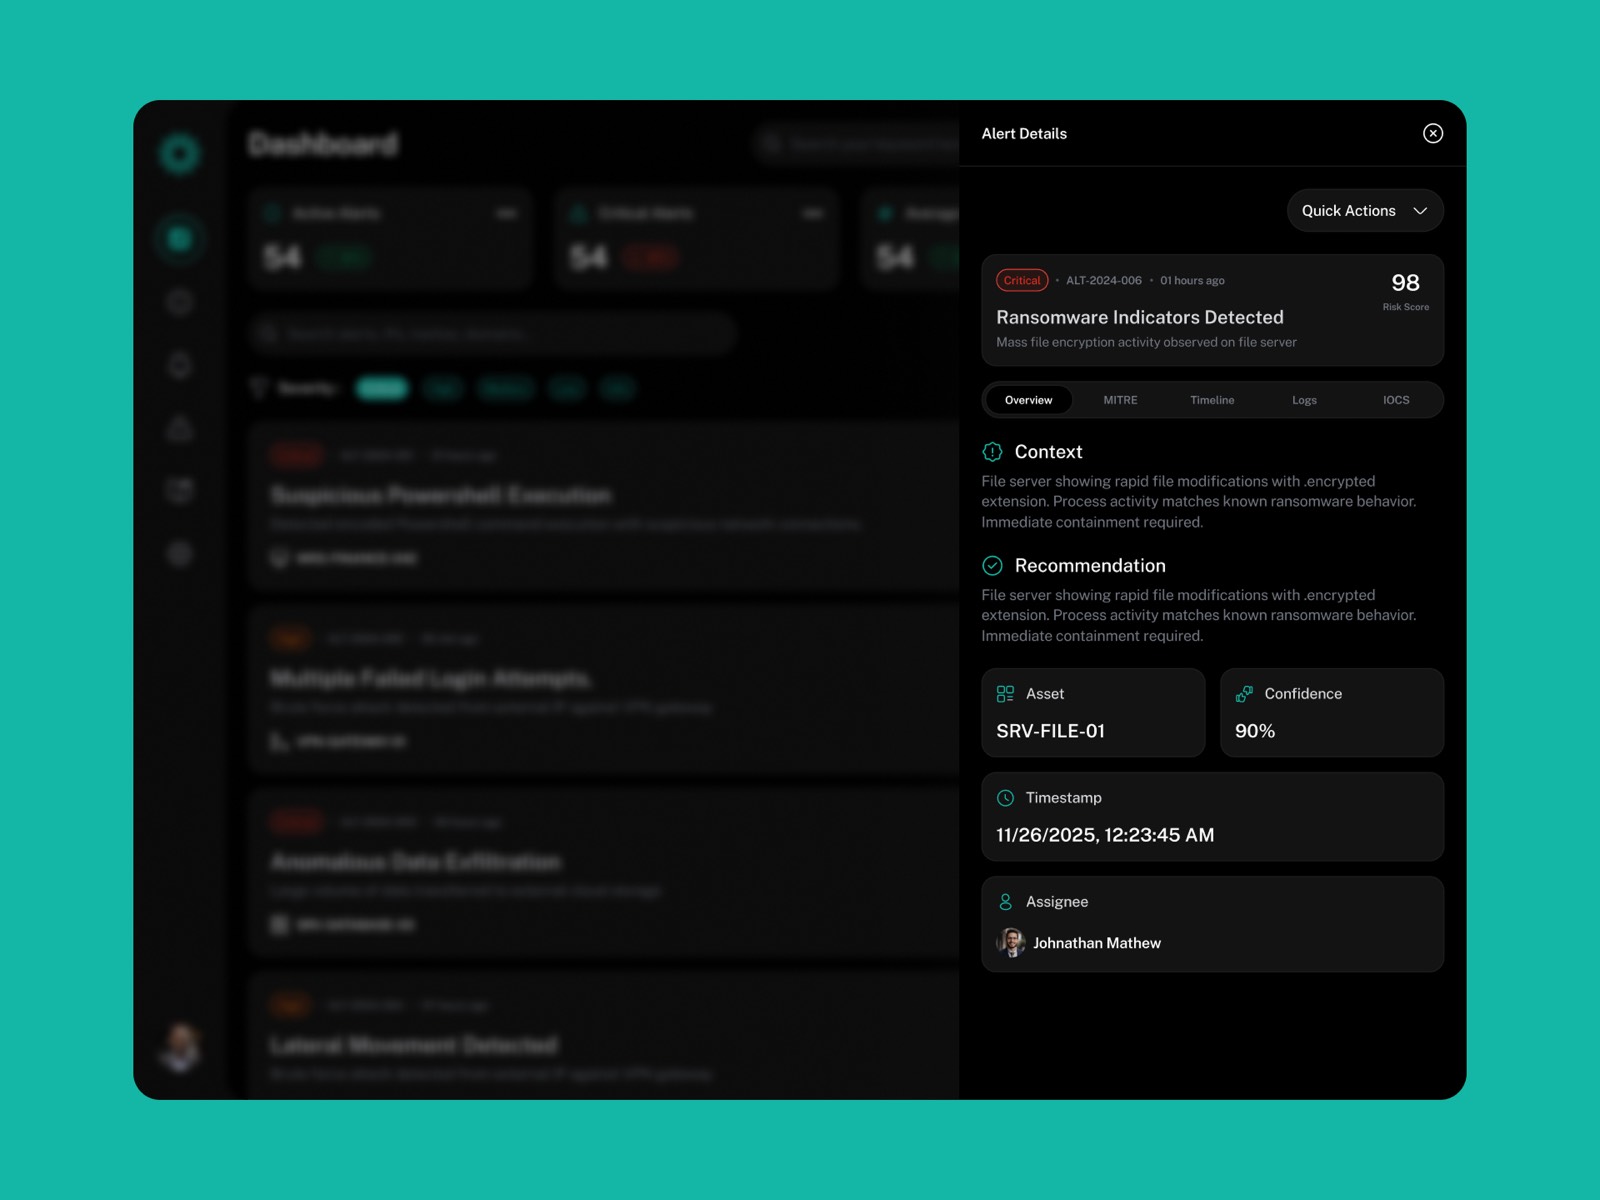
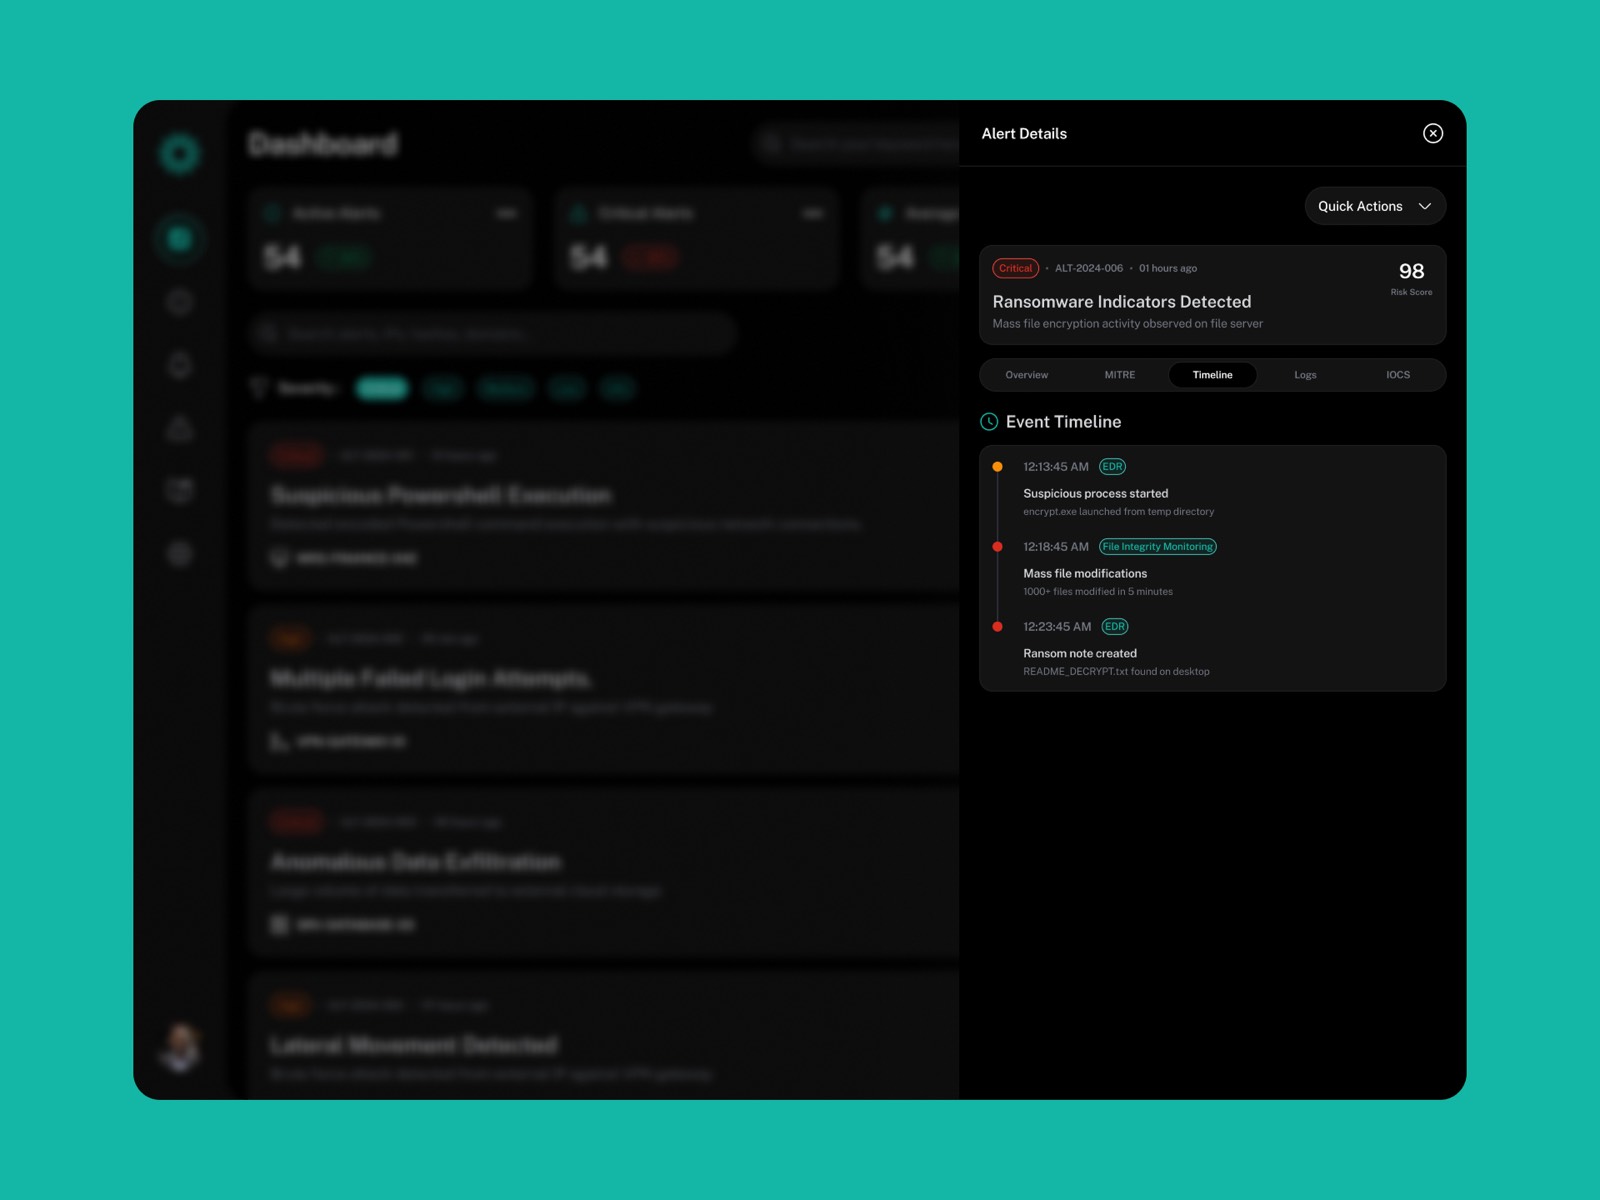
The incident drawer
Opens in place from the row and carries the severity and identity down, so you never lose your spot in the queue.
Logs and affected assets on the left, MITRE chain and the recommended action on the right, so your reading ends on the decision.
Kept under a 200ms open, so the drawer never slows down a call you make hundreds of times a shift.
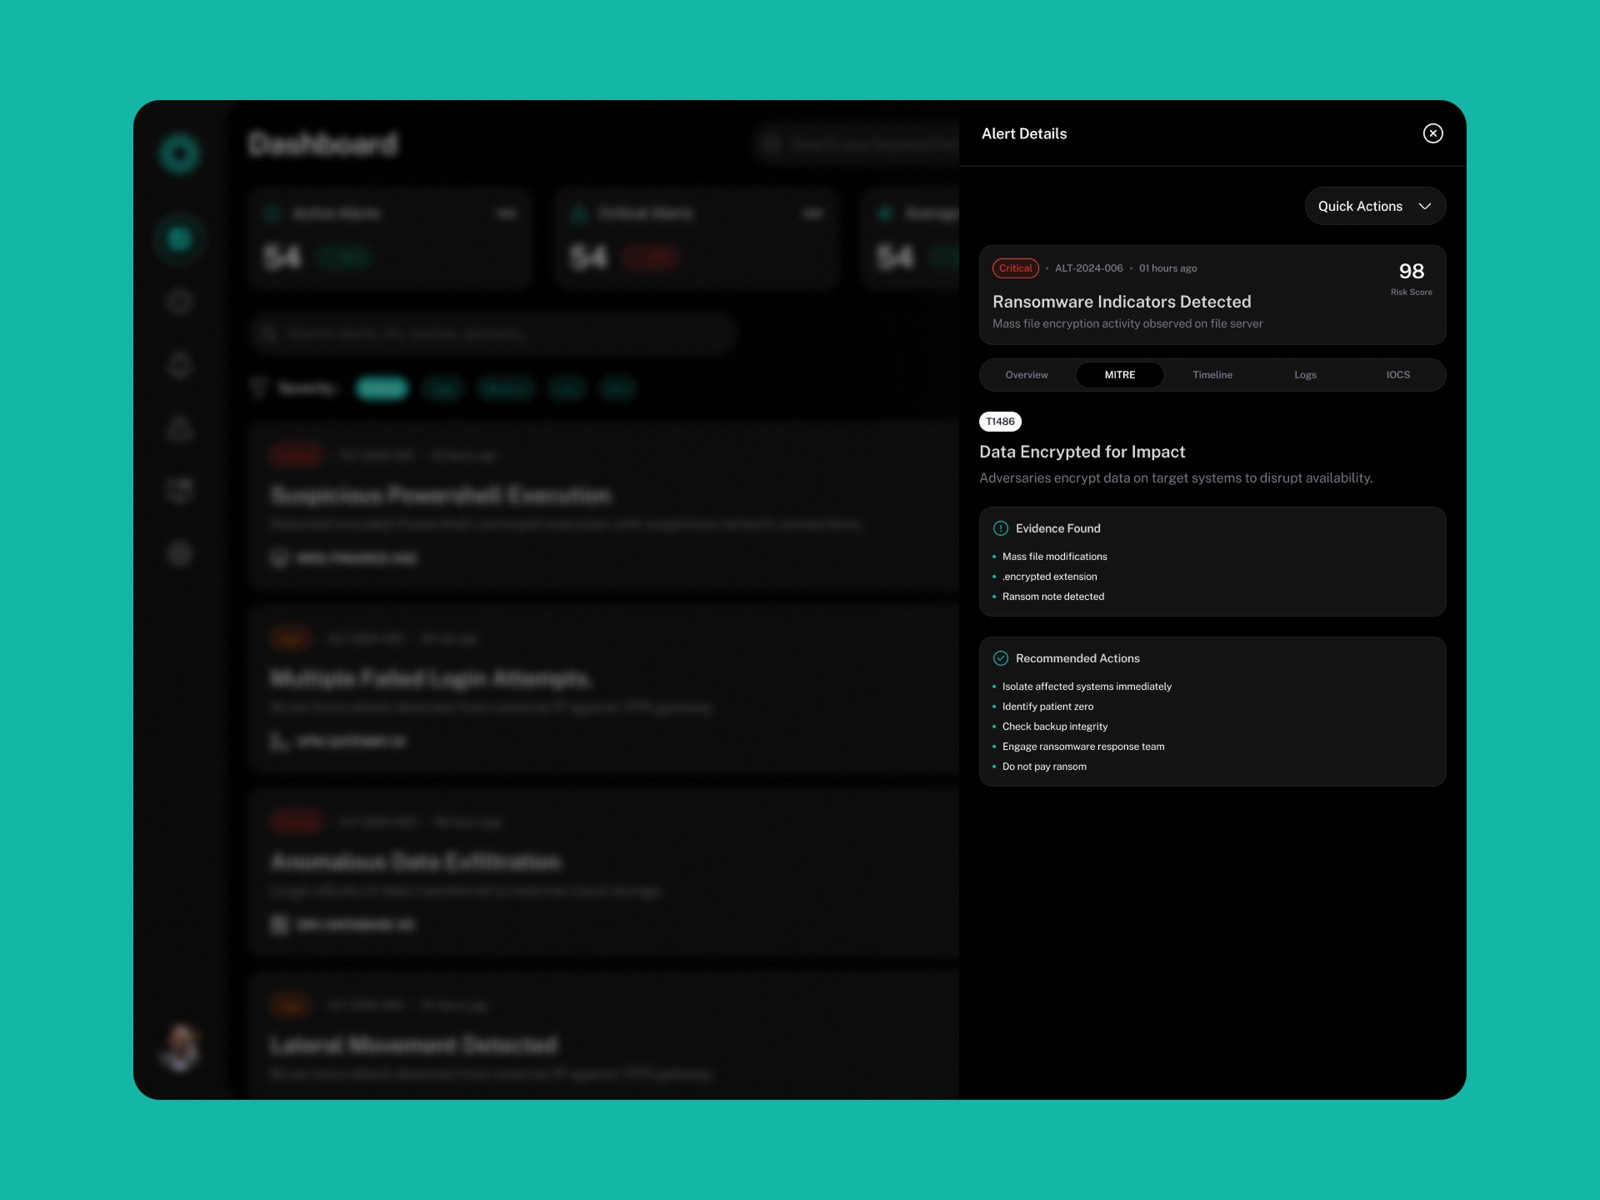
03
MITRE context + action
The ATT&CK chain draws in next to the alert, so a junior analyst gets the kill-chain story without opening a threat-intel tab.
The recommended action reads like an instruction with a confidence marker, there to help you decide, not to decide for you.
Act and dismiss carry equal weight, and the dismiss feeds the scoring loop, closing the gap the research turned up.
04
The cleared queue
The empty state reassures without making it sound like the shift is over: “Queue clear. Critical alerts surface here first.”
It points at where the next alert will show up, so your attention is already aimed at the right spot.
Even at rest, the critical band stays put as the anchor the whole screen is built around.
The UI was the easiest place to blow the whole thing. A good system shown ambiguously is still a missed alert, so I checked every decision here against the same question: what does this cost if someone misreads it at 3am.
What testing and the numbers said
The best idea in the project came from one line in round-2 testing. An analyst said dismissing felt pointless because nothing ever happened with it. That single comment led to the whole false-positive feedback loop. Sometimes the smallest note in testing is worth the most.
5Critical alerts always above the fold, zero missed
9→1Context-switches per incident reduced to one view
40%Reduction in mean time to triage (simulated testing)
3Role-aware views: Tier 1, Tier 2, SOC Manager
Two things I'd do differently. The Tier 2 and SOC Manager views didn't get enough attention in six weeks, and the mid-fidelity handoff left too much for engineering to guess at. And the two-panel fallback for smaller monitors should have been in v1, it turned into a support ticket within the first two weeks.
I call the 40% a simulated, pre-launch number everywhere I mention it, because in security, inflating a triage metric is exactly how people get hurt.
What this project changed in me
This project changed how I think about clarity. When someone can miss a real threat because a screen confused them, “clean design” stops being a nice-to-have. Every vague label was a risk. I still ask the same thing on every project now, what happens if someone misreads this at 3am, ten hours into a shift, before I worry about whether it looks good.
In short
Sentinel Dash is a single-screen triage dashboard for SOC analysts buried under 2,000+ alerts a shift across three to five tools. Three days of shadowing changed the problem from “too many alerts” to “too much tool-switching,” about nine hops per incident. I built a dark-mode, three-panel view that keeps the top 5 critical alerts above the fold, with MITRE ATT&CK context and a suggested action right there, plus a dismiss that feeds the scoring model. In simulated testing, mean time to triage dropped 40%, with separate views for Tier 1, Tier 2 and SOC Managers.